You may want time to time dig into the implementation detail of the code you are working with(e.g. how they are represented in RAM). Windbg with the help of SOS extension gives you lot of those implementation detail. But when the initial breakpoint is hit the CLR has not yet been loaded and Windbg doesn’t allow you to load SOS. What you can do here is that temporary set a Console.ReadLine() in your code and hit Ctrl + Break to break the debugger at your desired location.
Launch the executable from WinDbg, and then input “g” command to let debuggee process to continue until readLine statement. press Ctrl + Break or use menu->Debug->Break and then input command .loadby sos clr to load the SOS extension.
The Infinite Loop Technique
In case you are not working with a console app and you still need to break into a specific location you can use infinite loop technique. In this technique, you are injecting temporary infinite loop, based on the value of a global Boolean flag, into your code.
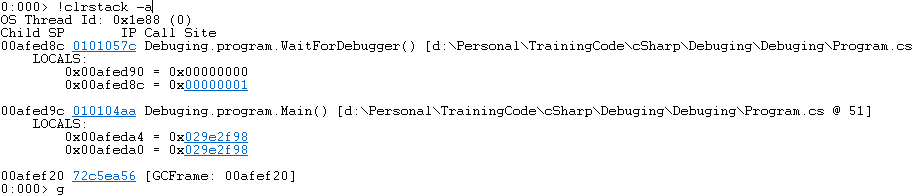
When you hit g in the debugger it will stop at the infinite loop. You can then break into the loop and set the boolean flag to true in memory window. To track the location of the local variable in the stack you can use !clrstack -a command. After setting the variable to true you can continue the execution by hitting g command to get out of the infinite loop.
Comments